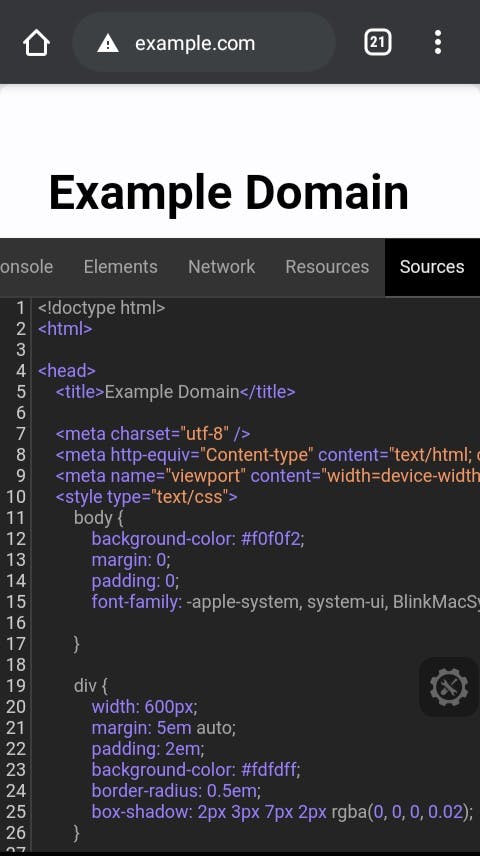
Recently, I was working on a side project with some friends. Unfortunately my PC had been damaged during the covid-19 pandemic and I couldn't get to fix it because of the lock-down, so I had to resort to coding on my mobile phone 🤦🏾♂️.
Somehow, my code works perfectly offline, but for some reasons, it did not go well online 🤒 And of course I'll be needing dev tool to access the console and check for errors.
Some minutes of googling later, I discovered it's very much possible to access the dev tool on mobile browsers with Eruda 🎉
Below is how you can do open the dev tool on chrome mobile browser
Step 0
Bookmark your current page by clicking the star ⭐ symbol from the chrome menu.
After doing this, you should see a toast message Bookmarked with an edit button:

Click the edit option and change the bookmark details to the following:
Name:
Mobile Dev Tool
URL (copy and paste code below):
javascript:(function () {var script=document.createElement('script');script.src="//cdn.jsdelivr.net/npm/eruda";document.body.appendChild(script); script.onload = function () { eruda.init() } })();
Step 1
- Visit the web page you want to inspect
- Enter the keyword Mobile Dev Tool into the search bar(you should see the page we bookmarked before with the url starting with javascript:...) click on the URL

- Wait for 3 Seconds for the Eruda icon to appear like below

- Click on the icon to open your dev tool

- Enjoy! 🎉
Here's what you can do with the Eruda dev tool
- View javascript console
- Inspect element
- Track Ajax requests
- View website source files
- Change CSS directly from web page
- And other awesome features
Conclusion
Eruda is an open sourced javascript package publicly hosted on github here and contributions are welcomed. If you'd found this article useful, c'mon show some love and share with your friends 🤗
Finally, I share and retweet tech stuffs on Twitter too follow me @asaolu_elijah
Thanks for reading ❤️
